Bootchart: boot profiling
February 24th, 2008 edited by TinchoIf you usually read Debaday, you must have noticed the recent lack of articles. We apologise for that, we’re lacking articles and editing manpower. We really need your help to keep the site running!
Article submitted by Stevem. Guess what? We still need you to submit good articles about software you like!
On a recent vacation my laptop boot time (>4 min.) started getting on my nerves. I resolved to enjoy the vacation but fix things on my return. At home a few minutes with Google brought bootchart to my attention.
Boothchart won’t cure lengthy boot times but it will provide details about how the time is spent. Bootchart is actually two packages, bootchart, the profiler daemon to gather resource data from /proc during boot, and bootchart-view to create an image from the collected data.
bootchartd starts measuring as soon as /proc is mounted. From /proc it collects a sizeable amount of data about processes, including (in 2.6 kernels) disk utilization and throughput.
The documentation suggests to use BSD process accounting to exactly reconstruct the process tree. The CONFIG_BSD_PROCESS_ACCT_V3 feature is enabled in stock Debian kernels, so to use this, you just need to install the acct package.
I expected profiling the system boot would be complicated and I was prepared for some serious hacking to measure the process. In fact, it couldn’t be much easier.
The boot profiler is started as an option to the boot/loader kernel command line.
It works with LILO but Grub’s interactive boot makes it very simple:
- Select your image entry from the boot menu
- Type ‘e‘ to edit the entry
- Append ‘init=/sbin/bootchartd‘ to the command line
- Type ‘b‘ and you’ll be booting with bootchart profiling in effect
bootchartd starts itself and then launches /sbin/init. There’s no indication that logging is in effect, console output appears as usual. Once you login you’ll find all the boot data stored in a compressed tar, /var/log/bootchartd.tgz.
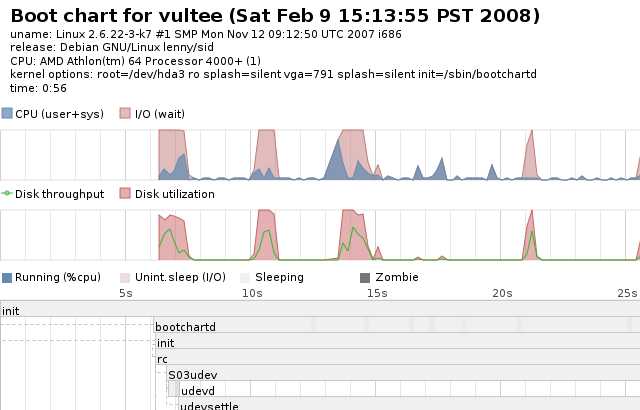
To view the data run bootchart-view. It defaults to creating a SVG image but EPS and PNG outputs are possible with the --format option.
Here’s an example of the output:
By default the chart renderer doesn’t display most ***** processes. If you think that level of detail will be helpful, bootchart-view has a --no-prune option. Be warned, it will create a fairly large image.
Conclusion: I still haven’t significantly decreased my boot time, many before me have tried and failed, but I discovered a clever, easy-to-use profiling tool to diagnose boot problems.
The bootchart-view package has been available .
The bootchart package has been available .
Posted in Debian, Ubuntu | 4 Comments »

